Affinity mapping is an excellent tool that can assist teams and individuals in efficiently organizing and analyzing vast volumes of information in a visual and collaborative manner. It is a method that is frequently used to aid in the discovery of patterns, insights, and themes from large, complicated data sets in design thinking, project management, and problem-solving processes.
This article will cover affinity mapping, how to do it yourself, and ways you can use these details to improve your research process.
Table of contents
What is affinity mapping?
Affinity mapping is a simple way to document your understanding of objects. It helps remove ambiguity, so you can make better decisions and move on in a way that’s good for you, your career, and your clients.
Affinity mapping is used by designers to organize information and therefore better understand their target audience, building a product or feature that will resonate with them.

Like other processes, affinity mapping only helps to make your design process easier. It is one of the many ways to get the best out of your research effectively. You can create an affinity map or affinity diagram to identify the areas where users make mistakes and how they navigate each step of the process. It allows you to see which pages visitors frequently use, which they avoid, and if any usability problems need to be addressed.
Affinity mapping also is a form of process mapping. For example, if you’re creating an exercise application, you would create a process map that breaks down each part of the end-user journey from the sign-up to completing the desired experience.
What is an affinity diagram?
Affinity diagrams are a visual way of capturing the values, relationships, and flows between elements in your design. They allow you to see which elements have strong relationships with each other and where those relationships are strongest. Affinity diagrams can help you see where a new idea will fit into your product and how it will affect the overall experience.
A simple affinity diagram is a pictorial representation of a data set and the relationships between different sets of users and the product you are working on.
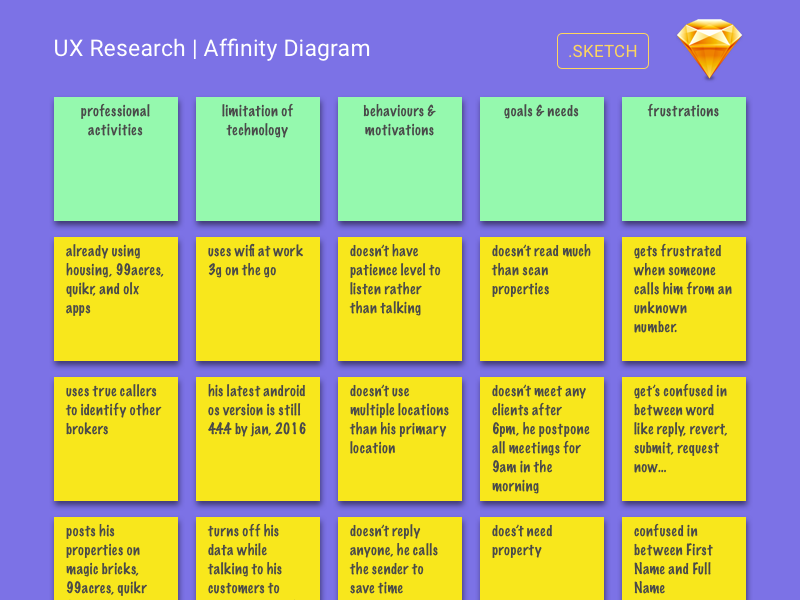
An affinity diagram is what you have once you have gone through the affinity mapping process. It is the final ”diagram” of your grouping, sorting, and categorizing. Here’s a great affinity diagram example by Abinash Mohanty from Dribble:

How to do affinity mapping
Affinity diagrams typically consist of three basic steps, each of which can be customized to suit your preferences and requirements.
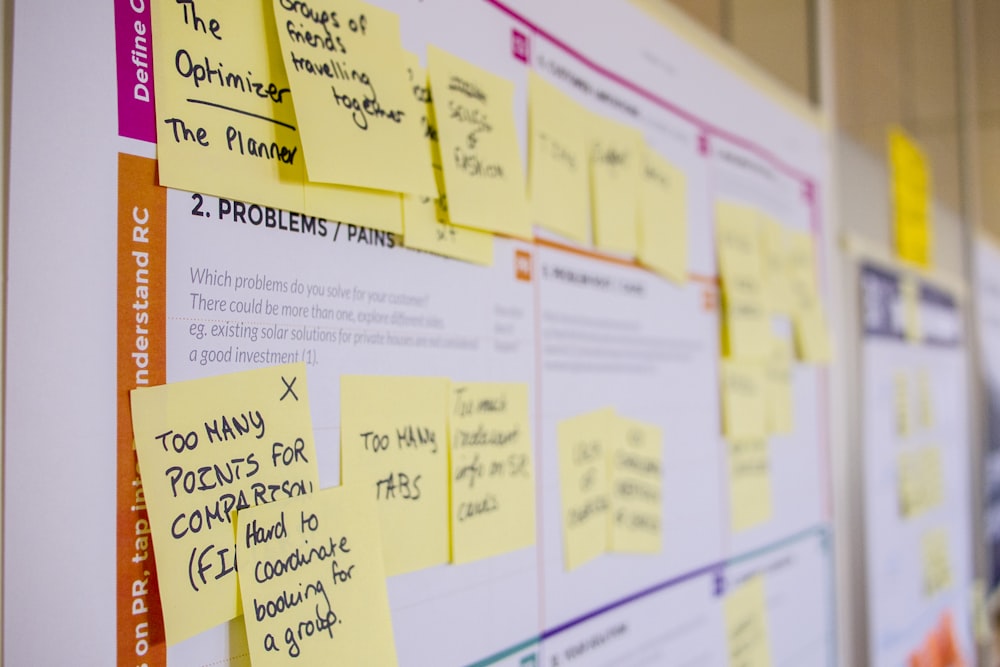
- Every idea or information should be written on a separate sticky note and then adhered to a wall.
- Gather related sticky notes into clusters by picking them up one at a time.
- Consider and debate the developed themes and categories, including how they affect your design process.
Two of the most used methods for affinity diagrams are the synthesis of qualitative research results and the analysis of concepts during the early stages of design ideation. Learn more about UX research in our guides.
Affinity mapping for synthesizing research

Here’s an example to illustrate better how to use an affinity map to combine qualitative research (such as user interviews, ethnographic observation, or usability testing):
Assume you are a UX researcher who has conducted user interviews to pinpoint the current and future needs that users will have for your product. You have talked to the user and taken thorough notes. The following steps will help to put everything together and identify any patterns.
1. Conduct a brainstorming session
Remember, an affinity map is created after gathering ideas. Start by writing down the problem you’re trying to solve or the question you’re trying to answer at the top of the whiteboard, then jot down individual ideas on sticky notes. It’s about getting as many ideas out of your brain as possible in your notebook. This requires a lot of work when creating affinity diagrams.
2. Write all the information on sticky notes
Always remember that the goal is to get as many sticky notes as possible on the wall. However, the more you put on the wall, the longer it will take to sort them. This is why it’s important to be thorough in finding the balance between the time you spend and the number of notes you need to collect.
Every piece of information that an interviewee provides is a potential data point. To keep everything arranged, take a look at your notes and write down any information that seems important.
3. Organize the sticky notes
Grab a sticky note, read it, and pin it in one place. Take another note, read it, and ensure it’s related to the first note. If so, put the second note next to the first. Otherwise, go far and start a new cluster. If you’re working in a group, give people a clear timeline and do this categorization together.
You should have 3-10 related groups you can name after common themes. Remember that you or your team should never decide on categories before the brainstorming session. Organize your ideas, and they should emerge organically.
A digital and more productive way to do so is creating a simple Open Card Sorting study. With UXtweak it’s free and allows you to conduct affinity mapping without having to deal with tons of paper cards. Moreover, you can involve anyone from all around the world to the test, by just sending them a link.
Affinity mapping for design ideation
After gathering the UX design team, you then hold an ideation session with them to brainstorm features that would solve a particular pain point or problem.
1. Sticky note all of your ideas
Give the design team members a fixed amount of time, say 3-5 minutes, to write or sketch their ideas. You should write down each concept on a different sticky note or index card. The idea can be expressed in any way, whether through low fidelity wireframes, a user flow diagram, or simply a single sentence. Everyone should put up their sticky notes when the allotted time has passed.
2. Arrange similar sticky notes together
Please spend some time considering each concept, then group or categorize them according to the good themes. Sort your ideas creatively, then pinpoint the most important ones that emerged.
3. Identify trends or insights to help you determine what to do next
Based on the ideas that you have drawn, talk about the best options with the design team. You must voice your worries and work through them. Decide which concepts the design team wants to pursue in more detail in the future. You can decide which ideas should be carried forward or given priority by voting, using markers and stickers, or letting each person express their opinion.
Benefits of affinity mapping

Affinity mapping is a process through which the person working on the project maps out and defines the areas of interest. It helps build a connection between the user and product, resulting in a better user experience.
It helps in identifying the personality traits of your users
Affinity mapping is considered one of the best ways to understand users’ needs and wants. Affinity mapping allows you to map out all aspects of your passion. The person should be able to share these aspects with others to work together on them. Understanding your users is an easy way to improve the overall quality of your product or service.
Effective teamwork
As a team, drawing an affinity diagram can be a dynamic (and equitable) way to sort through large amounts of data. Participants are encouraged to organize the information freely, frequently in silence, and without consulting the other team members.
It makes the design process easier
The diagram aids web and app designers in making sense of the intricate web of user requirements. Other than usability tests, interviews, chats, and other methods, you have many options for gathering customer feedback. Designers can effectively combine qualitative data from various sources into an understandable visual diagram using the affinity diagram.
Why affinity mapping is essential to user research
Whenever you’re working on a new product, it’s important to remember that your users are the most important aspect of your business. They want a good experience with the product or service, and the best way to give them that amazing experience is by understanding the customers.
An affinity diagram gives you a better understanding of your customer’s needs. This research process will help you arrange your user interviews and market research to pinpoint areas that need improvement and create a plan.
Ready for your first affinity map?
Register for your free UXtweak account and create affinity maps with our free card sorting tool!


